细讲Pandas
这一本书,让我写了整整一个月!!!这是用来给我们班级同学全面复习Pandas用的。这本书的图片以上传图床的方式呈现,但是可惜图片的显示有些问题,如果看不清,点进去可以在图床中阅览高解析度的图片。
预备知识:Python语法复习拓展
这里我会讲述一些Python语法拓展,并复习之前的部分内容,这样可以帮助你更好的、更高效的编写代码,并且加深你对Python这门语言的理解。
本书使用了一些这些语法,因为这些语法本身提高了可读性和编写效率。
类型
什么变量都有类型。在信息技术书中,只讲了Python的一些类型,如:
int;float;str;list,即列表;dict,即字典;
谁知道,Python的类型无数,但实际上仍被分为了两种:
- 值类型;
- 引用类型;
下面对其进行讲述。
值类型
值类型,即在变量中用实际值存储的类型。观察以下示例。
x = 1
y = x

print(x, y)
y = 2
print(x, y)
1 1
1 2
可以看到,将x变量的值赋给y后,两个变量的值相等,修改y的值,再次输出,原来的x变量的值并没有发生改变。
有人问,难不成还能发生改变吗?真的可以。
引用类型
观察下面的代码。看看和你猜测的结果是否一致。
x = [1, 2, 3, 4, 5]
y = x

print("x:", x)
print("y:", y)

print("modifying x[0] to 999")
x[0] = 999

print("x:", x)
print("y:", y)

print("modifying y[1] to 888")
y[1] = 888

print("x:", x)
print("y:", y)
x: [1, 2, 3, 4, 5]
y: [1, 2, 3, 4, 5]
modifying x[0] to 999
x: [999, 2, 3, 4, 5]
y: [999, 2, 3, 4, 5]
modifying y[1] to 888
x: [999, 888, 3, 4, 5]
y: [999, 888, 3, 4, 5]
奇怪了。修改的明明是x的第一个值,为什么y的值也被修改了?而且更奇怪的是,修改了y的第二个值,反而把x的第二个值修改了?肯定有蹊跷。
(请多次细读)
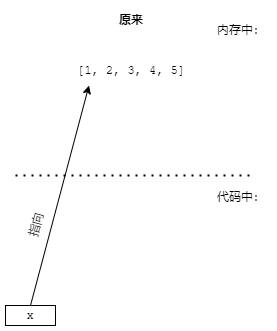
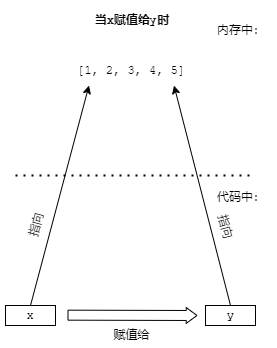
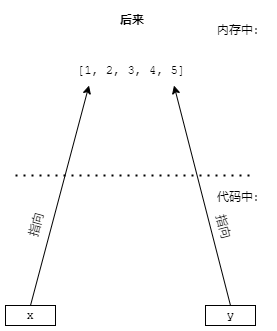
是有蹊跷。列表在Python中是引用类型,对于已存在的数据,将其赋值给一个变量将会 创建指向这个数据的引用。实际上,x实际上是一个类似于路标的东西(就是指针,一种底层的数据类型,用来指向内存中的数据),对于程序中所有对x的访问最终被指向(重定向,可以这么理解)到内存中的实际值。
将x的“值”赋给y实际上只是把x的方向“告诉”给了y,让x和y指向同一块内存,所以,所有对y的访问最终仍然是对内存中实际值的访问,所有的print语句都读取了实际值,而x[] y[]等赋值操作都写入了实际值。所以两个print语句输出的一定是一致的。
用形象一点的图表示。
| 原来 | 赋值时 | 后来 |
|---|---|---|
 |
 |
 |
现在,对于选择题中“方括号里应该填什么”的问题,不应该再错了。
元组及其赋值操作
使用一对(可选的)圆括号来包围以逗号相隔的值组成的值称为元组(tuple)。元组对我们来说,既是一个新的概念,也是一个我们见过的语法。因为我们在交换两个值时就会用它:
m = 1
n = 2
print(m, n)
m, n = n, m
print(m, n)
1 2
2 1
怎么创建空元组呢?使用一个圆括号便可以创建一个空元组:
tuple_2 = ()
print(tuple_2)
print(type(tuple_2))
()
<class 'tuple'>
但若要创建一个元素的元组,用括号围住,就会和括号包围住的表达式产生混淆:
maybe_tuple = (1)
print(maybe_tuple)
print(type(maybe_tuple))
1
<class 'int'>
此时需要在元素后面加上逗号(如(X,)),才不会产生混淆:
must_tuple = (1,)
print(must_tuple)
print(type(must_tuple))
(1,)
<class 'tuple'>
元组有自己的输出。
print((1, "hello", 3.2))
(1, 'hello', 3.2)
元组的组成可以不加圆括号,但是,在函数参数里填入元组时,必须加上圆括号,以和函数参数区分开来。这样做是无效的:
print(1, 2, 3)
1 2 3
元组可以赋给一个变量。
tuple_1 = (1, 2, 3)
#同样的操作: tuple_1 = 1, 2, 3
print(tuple_1)
(1, 2, 3)
元组也可以被解构:
(a, b, c) = tuple_1
print("a:", a)
print("b:", b)
print("c:", c)
a: 1
b: 2
c: 3
元组是值类型,但是在其中包含的类型不变,所以这样子是无效的:
(1, 2, 3) = (3, 4, 5)
  Cell In[84], line 1
    (1, 2, 3) = (3, 4, 5)
    ^
SyntaxError: cannot assign to literal
访问一个元组
使用方括号可以访问一个元组中的内容:
tuple_2 = (1, 2, 3)
print(tuple_2[0])
也可以使用len量度一个元组的大小:
print(len(tuple_2))
试图修改元组是无效的,但若其中包含的类型允许,可以修改其中的值:
tuple_3 = ([1, 2, 3], 4)
print("tuple_3:", tuple_3)
tuple_3[0][0] = 3
print("tuple_3:", tuple_3)
注意,此处我们并没有把[1, 2, 3]赋给一个变量,但因为内存中实际存在这个数据,所以可以修改一个没命名的数据!神奇吧!
一个鲜有人知的语法点是,一个列表可以赋值给一个“列表”。观察下面的示例。
[a, b] = [1, 2]

list_1 = [1, 2, 3]
[c, d, e] = list_1

print(a, b, c, d, e)
1 2 1 2 3
注意实际上[a, b]和[c, d, e]本身并没有组成一个列表,只是长这样,了解一下。
所以,现在可以判断为什么下面这么合理的代码会报错了:
a = 1, b = 2
print(a, b)
  Cell In[86], line 1
    a = 1, b = 2
        ^
SyntaxError: cannot assign to literal
这是因为,1, b被组成了一个元组,所以这段代码试图用一个2对一个元组(1, b)赋值,也就是说,上面的代码,等价于:
a = (1, b) = 2
print(a, b)
  Cell In[159], line 1
    a = (1, b) = 2
        ^
SyntaxError: cannot assign to literal
列表,和列表内循环
这是我们熟悉的列表。
[1, 2, 3, 4, 5]
那么,这又是什么玩意?
[x for x in range(100)]
这是列表内循环,用来构造一个列表。其中第一个x是组成列表的表达式,由循环变量组成,第二个x是循环变量的声明,与我们熟悉的for循环类似,通过for循环的执行让表达式的值不断更新,以此组成列表。
试试看。
print([x for x in range(100)])
列表内还可以包含双层循环。相当于两个循环的嵌套,可以组成更多的值:
print([(x, y) for x in range(10) for y in range(10)])
[(0, 0), (0, 1), (0, 2), (0, 3), (0, 4), (0, 5), (0, 6), (0, 7), (0, 8), (0, 9), (1, 0), (1, 1), (1, 2), (1, 3), (1, 4), (1, 5), (1, 6), (1, 7), (1, 8), (1, 9), (2, 0), (2, 1), (2, 2), (2, 3), (2, 4), (2, 5), (2, 6), (2, 7), (2, 8), (2, 9), (3, 0), (3, 1), (3, 2), (3, 3), (3, 4), (3, 5), (3, 6), (3, 7), (3, 8), (3, 9), (4, 0), (4, 1), (4, 2), (4, 3), (4, 4), (4, 5), (4, 6), (4, 7), (4, 8), (4, 9), (5, 0), (5, 1), (5, 2), (5, 3), (5, 4), (5, 5), (5, 6), (5, 7), (5, 8), (5, 9), (6, 0), (6, 1), (6, 2), (6, 3), (6, 4), (6, 5), (6, 6), (6, 7), (6, 8), (6, 9), (7, 0), (7, 1), (7, 2), (7, 3), (7, 4), (7, 5), (7, 6), (7, 7), (7, 8), (7, 9), (8, 0), (8, 1), (8, 2), (8, 3), (8, 4), (8, 5), (8, 6), (8, 7), (8, 8), (8, 9), (9, 0), (9, 1), (9, 2), (9, 3), (9, 4), (9, 5), (9, 6), (9, 7), (9, 8), (9, 9)]
字符串的格式化
字符串的格式化非常有用,可以用来制表格,美化输出。
使用%运算符格式化字符串
在字符串后使用取余%运算符,后接一个元组作为参数,可以对字符串进行格式化。观察下面的代码。
print("hello %s!" % ("format"))
print("")
print("")
print("%10s %10s %10s" % ("name", "age", "score"))
print("")
print("%10s %10d %10.2f" % ("alice", 16, 57.135554))
print("%10s %10d %10.2f" % ("bob", 15, 64.5))
print("%10s %10d %10.2f" % ("mike", 21, 77.1354))
print("%10s %10d %10.2f" % ("dave", 18, 27.0))
print("%10s %10d %10.2f" % ("carol", 16, 37.315))
hello format!


      name        age      score

     alice         16      57.14
       bob         15      64.50
      mike         21      77.14
      dave         18      27.00
     carol         16      37.31
可以看到字符串格式化的魅力,但是,在%运算符左边的字符串里,那些%10d %10.2f %10s是什么意思呢?
在字符串中使用%后带特定意义的数字、字母和符号的单位叫做格式说明符。有下列常用的格式说明符:
s,代表输出字符串;d,代表输出十进制整数(decimal);f,代表输出十进制浮点数;e,代表输出科学计数法的浮点数(如3.73e+01,代表$3.73\times{}10^{1}$)o,代表输出八进制整数(octal);x,代表输出十六进制整数(hexadecimal);
格式说明符和%之间不能有空格,而且必须小写。例如% s %D等都是错的,而例如%s %d等都是对的。
在格式说明符和%之间插入对齐和精度要求等,可以让输出对齐,并保留指定的小数位,以及其他要求。例如,%10s可以让输出的字符串靠右对齐,总长度为10:
print("%10s" % ("abcde"))
print("^^^^^^^^^^")
     abcde
^^^^^^^^^^
而当输出的字符串超出对齐要求时,将不会截取字符串,而按原样输出:
print("%10s" % ("abcdefghijklmno"))
print("^^^^^^^^^^")
abcdefghijklmno
^^^^^^^^^^
当然,没有对齐要求,只有一个%s便可以输出,没有问题:
print("%s" % ("abcde"))
abcde
f说明符可以输出浮点数,在对齐要求(可选)的后面加上“.位数”便可以控制输出保留的小数位数(注意不是保留几位有效位):
print("%5.2f %.5f" % (3.14, 3.14159265358979))
3.14 3.14159
第二个格式说明符没有对齐要求,只有一个.5,将不会对齐,仅保留5位有效位。
当然,格式化字符串不止这一种方法。
使用f-string格式字符串(推荐)
在字符串的引号(单引号,双引号,三引号)前面加f(例如f"" f'' f''' f""",f和引号之间不能有空格)可以让一个字符串变成f-string,f-string给Python添加了一种更加可读的字符串格式化方式,增强了可用性。f-string使用花括号括住要输出的表达式,在输出时会把花括号的内容替换掉。观察:
print(f"{10.1234}")
x = 1
y = 2
print(f"{x} + {y} = {x + y}")
10.1234
1 + 2 = 3
下面使用f-string来打印之前的表格。
print(f'{"name" :>10} {"age" :>10} {"score" :>10}')
print("")
print(f'{"alice" :>10} {16 :>10} {57.135554 :>10.2f}')
print(f'{"bob" :>10} {15 :>10} {64.5 :>10.2f}')
print(f'{"mike" :>10} {21 :>10} {77.1354 :>10.2f}')
print(f'{"dave" :>10} {18 :>10} {27.0 :>10.2f}')
print(f'{"carol" :>10} {16 :>10} {37.315 :>10.2f}')
      name        age      score

     alice         16      57.14
       bob         15      64.50
      mike         21      77.14
      dave         18      27.00
     carol         16      37.31
f-string的格式说明符非常简洁,使用>向右对齐,使用<向左对齐,使用^向中间对齐。在对齐要求后面加上类似于%格式字符串的控制说明符也可以作同样的精度控制操作。
如果要在f-string中输出}和{字符需要使用两个花括号,否则会引起歧义而报错。输出引号(单引号、双引号)也需要适当的转义,否则也报错。观察:
print(f"print(f\" + = \") produces:\n{x} + {y} = {x + y}")
print(f"{x} + {y} = {x + y}") produces:
1 + 2 = 3
Pandas
pandas是python的数据分析和处理库,可以方便的对大型数据,及其数据源进行操作。
其主要数据结构是Series和DataFrame。
Series
Series是一种一维的数据结构,每一个Series都有index(索引),可以理解为字典的键(key),使用索引可以用来访问指定的数据,使用数字也可以对Series进行基于下标的数据访问,两者都是通过方括号,只是索引的类型不一样。
先导入需要的包,并设置pandas的对齐显示。
import pandas as pd
import numpy as np
import matplotlib.pyplot as plt
pd.set_option("display.unicode.ambiguous_as_wide", True)
pd.set_option("display.unicode.east_asian_width", True)
使用pd.Series构造函数来创建Series数据结构
series_1 = pd.Series()
data_1 = [1, 2, 3, 4, 5, 6, 7, 8, 9]

series_2 = pd.Series(data_1)

print(series_1)
print(series_2)
Series([], dtype: object)
0    1
1    2
2    3
3    4
4    5
5    6
6    7
7    8
8    9
dtype: int64
第一个pd.Series没有任何的参数,创建的是空Series对象,data_1里面是一个python列表,pd.Series构造函数可以接受任何的一维数据结构(细说的话,就是满足 array-like, Series, ndarray-like或ExtensionArray )并相应的转换成Series对象。
可以看到,pd.Series构造函数对于没有特定索引值的数据,自动分配了从0开始的下标索引。
dtype的意思是Series中数据的类型,注意不是索引的类型。此时的dtype是int64,因为python对于程序里面的整数默认使用64位宽($0$到$2^{64}-1$,也就是$0$到$18446744073709551615$)。
由于每个Series都有索引值,所以使用字典创建Series也在Pandas中得到了支持:
data_2 = {
    "123" : "456",
    "789" : "012",
}

series_3 = pd.Series(data_2)

print(series_3)
123    456
789    012
dtype: object
此时,series_3中的索引变成了"123"和"456",而且由于值的类型是字符串(python的str对象),所以dtype的值变为了object。
除了用字典可以为Series分配索引,我们可以在pd.Series构造函数里面使用显式参数index来指定Series的索引值:
print(data_1)

series_4 = pd.Series(data_1, index=[8, 7, 6, 5, 4, 3, 2, 1, 0])
print(series_4)
print(series_2)
[1, 2, 3, 4, 5, 6, 7, 8, 9]
8    1
7    2
6    3
5    4
4    5
3    6
2    7
1    8
0    9
dtype: int64
0    1
1    2
2    3
3    4
4    5
5    6
6    7
7    8
8    9
dtype: int64
这里把series_2也打印了出来,可以看到索引值上的区别。
直接访问Series中的数据
这里拓展一个Python的语法点,一个类型中可以有 “属性”,即看起来是变量(如下文的some_series.values)的东西称为类的属性。
但同时一个类也可以有公有变量,如下文的some_series.index。
任何一个Series都有以下属性:
T属性用来转置(即将行列转$90^{\circ{}}$)一个数据结构;array属性用来得到Series的列表表示;values属性用来得到Series的ndarray表示;dtype属性用来得到Series的数据类型;shape属性用来得到Series的形状,作为元组返回,并且(根据Series的定义,)永远只有一个元素;nbytes属性用来得到Series中数据所占的内存大小,单位为字节;ndim属性用来得到Series的维度,并且(根据Series的定义,)恒为$1$;size属性用来得到Series中元素数量;hasnans属性,若Series中有任何无效(NaN)数据则为True,否则为False;empty属性,若Series中无元素则为True,否则为False;name属性,其中是Series的名字(等一下);index属性,其中是Series的索引值。
同时Series还有index变量用来读取Series中的索引值。下面简要介绍一些这些变量和属性的用法。
test_series = pd.Series([1, "spam", 3.2, False, np.nan],
                        name="a_test_series",
                        index=["foo", "bar", "baz", "qux", "cat"])

print(f"""
{test_series}

test_series.name: {test_series.name}
test_series.values: {test_series.values}
test_series.empty: {test_series.empty}
test_series.dtype: {test_series.dtype}
test_series.hasnans: {test_series.hasnans}
test_series.size: {test_series.size}
test_series.shape: {test_series.shape}
test_series.array:
{test_series.array}

test_series.T:
{test_series.T}

test_series.nbytes: {test_series.nbytes}
test_series.ndim: {test_series.ndim}
test_series.index: {test_series.index}
""")
foo        1
bar     spam
baz      3.2
qux    False
cat      NaN
Name: a_test_series, dtype: object

test_series.name: a_test_series
test_series.values: [1 'spam' 3.2 False nan]
test_series.empty: False
test_series.dtype: object
test_series.hasnans: True
test_series.size: 5
test_series.shape: (5,)
test_series.array:
<PandasArray>
[1, 'spam', 3.2, False, nan]
Length: 5, dtype: object

test_series.T:
foo        1
bar     spam
baz      3.2
qux    False
cat      NaN
Name: a_test_series, dtype: object

test_series.nbytes: 40
test_series.ndim: 1
test_series.index: Index(['foo', 'bar', 'baz', 'qux', 'cat'], dtype='object')
Series是可以有名字的,在构造函数中使用name命名参数便可以指定名字。名字有什么用吗?当你从DataFrame中索引一个列时,Series便会有名字,是当前列的名字。使用.values属性可以访问Series的ndarray形式。使用.array可以访问Series的PandasArray形式。
T属性(因为Series的定义,)本身不对Series作任何的操作。
nbytes属性用来得到Series中数据所占的内存大小,单位为字节;
ndim属性用来得到Series的维度,即1;
使用index变量可以直接访问Series的索引值,并且可以修改。
使用astype方法可以将一个Series中的所有值转换为参数里指定的类型:
series_float = pd.Series([1.0, 2.0, 3.0, 4.0])

print(series_float)
print(series_float.astype("int64"))
0    1.0
1    2.0
2    3.0
3    4.0
dtype: float64
0    1
1    2
2    3
3    4
dtype: int64
操作Series对象
数据总是可以操作的,对于Series尤为如此。
我们可以修改Series中特定的值,先拷贝series_2中的数据到series_5变量中。
series_5 = series_2.copy()
为什么需要用
> series_5 = series_2.copy(),而不是series_5 = series_2呢?这是因为Series是python中的类,是引用类型,需要使用copy()方法来避免创建原来数据的引用。
下面所有示例我将使用series_5.values来将其中的值以ndarray的方式输出,以节省篇幅。
ndarray是numpy中的数据格式,相当于对Python列表的拓展(这种说法是不专业的,但,可以先这么理解)。ndarray中的数据类型是固定的,而Series中的数据类型是可变的,比如,
series_5.values中的数据类型是object,而series_2.values中的数据类型是int64。使用
.values可以将Series中的数据以ndarray的方式返回。
series_5[0] = "foo"
series_5[1] = "bar"

print(series_5.values)
['foo' 'bar' 3 4 5 6 7 8 9]
注意,因为我之前使用copy()方法拷贝了原数据的副本,所以我并没有修改series_2的数据:
print(series_2.values)
[1 2 3 4 5 6 7 8 9]
注意,此处的
series_2.values是ndarray数据格式,不是Series,所以不能采用Series中的一些操作(即使numpy有pandas Series的类似操作,但毕竟不能搞混)。
修改Series中的值
准备数据。series_6和series_7按原样输出,以观察索引值。
series_6 = pd.Series(data_1,
                     index=["foo", "bar", "baz", "qux", "sec", "oct", "min", "max", "avg"])
print(f"series_6.values: {series_6.values}")
print(f"series_6.index: {series_6.index.values}")

series_7 = pd.Series(data_1)
print(f"series_7.values: {series_7.values}")
print(f"series_7.index: {series_7.index.values}")
series_6.values: [1 2 3 4 5 6 7 8 9]
series_6.index: ['foo' 'bar' 'baz' 'qux' 'sec' 'oct' 'min' 'max' 'avg']
series_7.values: [1 2 3 4 5 6 7 8 9]
series_7.index: [0 1 2 3 4 5 6 7 8]
通过索引值可以修改一个元素。观察修改后输出的区别:
series_6["min"] = 123
series_7[3] = 123

print(f"series_6.values: {series_6.values}")
print(f"series_6.index: {series_6.index.values}")
print(f"series_7.values: {series_7.values}")
print(f"series_7.index: {series_7.index.values}")
series_6.values: [  1   2   3   4   5   6 123   8   9]
series_6.index: ['foo' 'bar' 'baz' 'qux' 'sec' 'oct' 'min' 'max' 'avg']
series_7.values: [  1   2   3 123   5   6   7   8   9]
series_7.index: [0 1 2 3 4 5 6 7 8]
通过下标也可以修改一个元素:
series_6[0] = 999
print(f"series_6.values: {series_6.values}")
print(f"series_6.index: {series_6.index.values}")
series_6.values: [999   2   3   4   5   6 123   8   9]
series_6.index: ['foo' 'bar' 'baz' 'qux' 'sec' 'oct' 'min' 'max' 'avg']
为什么不能用下标值修改series_7?因为series_7的索引值与下标值的类型相同(都是int),用int类型索引series_7正是使用索引值访问数据,下标的功能便被覆盖了。
Series的运算
Series(向量)与标量操作
通过+,-,*,/等运算符,可以对Series(术语常称“向量”)进行逐元素的运算,即,运算对于每一个数据都会应用一遍,首先是Series与标量(一个数据)相操作:
series_8 = pd.Series([1, 2, 3, 4, 5, 6, 7, 8])

print(f"series_8 + 2:\n{(series_8 + 2).values}")
print(f"series_8 - 2:\n{(series_8 - 2).values}")
print(f"series_8 * 2:\n{(series_8 * 2).values}")
print(f"series_8 / 2:\n{(series_8 / 2).values}")
print(f"(series_8 / 2)'s dtype:\n{(series_8 / 2).dtype}")
series_8 + 2:
[ 3  4  5  6  7  8  9 10]
series_8 - 2:
[-1  0  1  2  3  4  5  6]
series_8 * 2:
[ 2  4  6  8 10 12 14 16]
series_8 / 2:
[0.5 1.  1.5 2.  2.5 3.  3.5 4. ]
(series_8 / 2)'s dtype:
float64
注意到由于相除运算的结果是浮点数,所以第四个输出(series_8 / 2)得到的Series的dtype为float64(即double,IEEE-754双精度浮点数)。
几乎所有Python中可以对数值干的事情,都可以对Series应用,也就是说,你可以:
- 用
==!=>=<=<>等关系运算符让Series与标量(以及,Series)比较; - 用
%运算符取余数(术语常称,“取模”); - …
同样的操作也可以由Series中的方法来实现:
print(f"series_8 + 2 using methods:\n{series_8.add(2).values}")
print(f"series_8 - 2 using methods:\n{series_8.sub(2).values}")
print(f"series_8 * 2 using methods:\n{series_8.mul(2).values}")
print(f"series_8 / 2 using methods:\n{series_8.div(2).values}")
series_8 + 2 using methods:
[ 3  4  5  6  7  8  9 10]
series_8 - 2 using methods:
[-1  0  1  2  3  4  5  6]
series_8 * 2 using methods:
[ 2  4  6  8 10 12 14 16]
series_8 / 2 using methods:
[0.5 1.  1.5 2.  2.5 3.  3.5 4. ]
此处(
series_8 / 2 using methods那行输出)的1.2.3.4.看起来很奇怪,因为我们对series_8调用addsubmuldiv时返回的是Series对象,对其应用.values便把其中的数据转换成了ndarray对象,而numpy在输出ndarray中的浮点数时,只会输出有效位,所以1.02.0等数字中的0被去掉了,留下的只有1.2.3.4.。
得到的结果完全一致。因为Series只是对其实现中的类增加了相应的运算符重载,调用的便是这些方法。
可以用来计算的方法还有很多,例如有:
mod用来取模,对应%运算符;pow用来乘方,对应**运算符;round用来四舍五入,对应math.round方法;lt代表小于,对应<运算符,(less than)用来比较左边和参数的大小,此外还有:gt,大于,(greater than),对应>运算符;le,小于等于,(less or equals),对应<=运算符;ge,大于等于,(greater or equals),对应>=运算符;eq,等于,(equals),对应==运算符;ne,不等于,(not equals),对应!=运算符;
abs用来取绝对值,对应math.abs方法,不需要参数;mean用来取平均值,不需要参数;var用来取方差,不需要参数;std用来取标准差,不需要参数;sum取和,不需要参数;median取中位数,不需要参数;
Series(向量)与Series(向量)
Series不仅可以与标量操作,也可以与另外一个Series操作,同样是使用相应的方法进行运算(add sub mul div等,或运算符+ - * /等),但可以对两个向量中的元素逐个操作。这里创建另外一个Series,并将它们的值输出。
series_9 = pd.Series([8, 7, 6, 5, 4, 3, 2, 1])
print(series_8.values)
print(series_9.values)
[1 2 3 4 5 6 7 8]
[8 7 6 5 4 3 2 1]
同样地使用运算符操作两个向量(注意不是向量和标量了!)series_8和series_9,观察结果:
series_10 = series_8 + series_9
print(series_10.values)
[9 9 9 9 9 9 9 9]
数据是凑过的,所以相当于等差数列逆序相加,和为$9$。
同样地运用其他运算符操作两个向量,观察:
print((series_8 - series_9).values)
print((series_8 * series_9).values)
print((series_8 / series_9).values)
[-7 -5 -3 -1  1  3  5  7]
[ 8 14 18 20 20 18 14  8]
[0.125      0.28571429 0.5        0.8        1.25       2.
 3.5        8.        ]
同样地运用其他方法操作两个向量,观察:
print((series_8.add(series_9)).values)
print((series_8.sub(series_9)).values)
print((series_8.mul(series_9)).values)
print((series_8.div(series_9)).values)
[9 9 9 9 9 9 9 9]
[-7 -5 -3 -1  1  3  5  7]
[ 8 14 18 20 20 18 14  8]
[0.125      0.28571429 0.5        0.8        1.25       2.
 3.5        8.        ]
所以pandas的逻辑在我们的脑海里慢慢的熟悉起来了,要么是一对多,要么是多对多,永远是逐项操作。
当不同长度的Series互相操作时,缺的数据会变成NaN。观察:
oops_1 = pd.Series([1, 2, 3, 4])
oops_2 = pd.Series([1, 2, 3])

print(oops_1 + oops_2)
0    2.0
1    4.0
2    6.0
3    NaN
dtype: float64
Series的排序
使用sort_values或者sort_index可以依照Series中的 值 或 索引 对Series排序。
sort_values:依照值来排序
sort_values依照值对Series进行排序。下面是一个示例,创建一个有10个介于$(1,100)$之间的整数Series,输出原来数据和排序过的数据,观察区别:
import random
series_10 = pd.Series([random.randint(1,100) for i in range(10)])
print(f"raw data: {series_10.values}")
print(f"sorted: {series_10.sort_values().values}")
raw data: [62 17 12 70 51 27 42 34 93 29]
sorted: [12 17 27 29 34 42 51 62 70 93]
通过指定命名参数ascending,可以制定排序的顺序。ascending接受一个布尔型值作为参数,
- 若为
True,则按升序排序,这也是这个参数的默认值(在你未指定这个参数时); - 若为
False,则按降序排序。
注意,
sort_values()和下文的sort_index()函数都不会修改原来的值,而是返回一个新的Series对象。
下面的示例把series_10再次调用sort_values,并指定ascending参数为True和False,观察区别:
print(f"raw data: {series_10.values}")
print(f"sorted with ascending=True: {series_10.sort_values(ascending=True).values}")
print(f"sorted with ascending=False: {series_10.sort_values(ascending=False).values}")
raw data: [54 44  5 32 57 34 91 74 94 30]
sorted with ascending=True: [ 5 30 32 34 44 54 57 74 91 94]
sorted with ascending=False: [94 91 74 57 54 44 34 32 30  5]
sort_index:按照索引值来排序
由于Series可以指定索引值,所以我们可以按照相应的方法按照索引值的先后顺序排序一个Series。这便是sort_index的作用。
下面创建两个含有十个元素的Series,指定索引值并调用sort_index,观察结果:
series_11 = pd.Series([1, 2, 3, 4, 5, 6, 7, 8, 9, 10],
                      index=[10, 9, 8, 7, 6, 5, 4, 3, 2, 1])
series_12 = pd.Series([1, 2, 3, 4, 5, 6, 7, 8, 9, 10],
                      index=["foo", "bar", "baz", "qux", "min", "max", "yoo", "matt", "mike", "dave"])
print("series_11:")
print(f"\tseries_11.values: \n\t{series_11.values}")
print(f"\tseries_11.index: \n\t{series_11.index.values}")
print("using sort_index:")
print(f"\tseries_11.sort_index().values: \n\t{series_11.sort_index().values}")
print(f"\tseries_11.sort_index().index: \n\t{series_11.sort_index().index.values}")

print("series_12:")
print(f"\tseries_12.values: \n\t{series_12.values}")
print(f"\tseries_12.index: \n\t{series_12.index.values}")
print("after sort_index:")
print(f"\tseries_12.sort_index().values: \n\t{series_12.sort_index().values}")
print(f"\tseries_12.sort_index().index: \n\t{series_12.sort_index().index.values}")
series_11:
	series_11.values:
	[ 1  2  3  4  5  6  7  8  9 10]
	series_11.index:
	[10  9  8  7  6  5  4  3  2  1]
using sort_index:
	series_11.sort_index().values:
	[10  9  8  7  6  5  4  3  2  1]
	series_11.sort_index().index:
	[ 1  2  3  4  5  6  7  8  9 10]
series_12:
	series_12.values:
	[ 1  2  3  4  5  6  7  8  9 10]
	series_12.index:
	['foo' 'bar' 'baz' 'qux' 'min' 'max' 'yoo' 'matt' 'mike' 'dave']
after sort_index:
	series_12.sort_index().values:
	[ 2  3 10  1  8  6  9  5  4  7]
	series_12.sort_index().index:
	['bar' 'baz' 'dave' 'foo' 'matt' 'max' 'mike' 'min' 'qux' 'yoo']
可以看到,sort_index通过索引值的类型排序的顺序排序了series_11和series_12,由于series_12的索引值是字符串,所以sort_index依照字典序排序。
同时,sort_index也可以使用ascending命名参数来指定排序的顺序。观察:
print("series_12:")
print(f"\tseries_12.values: \n\t{series_12.values}")
print(f"\tseries_12.index: \n\t{series_12.index.values}")
print("after sort_index with ascending=True:")
print(f"\tseries_12.sort_index(ascending=True).values: \n\t{series_12.sort_index(ascending=True).values}")
print(f"\tseries_12.sort_index(ascending=True).index: \n\t{series_12.sort_index(ascending=True).index.values}")
print("after sort_index with ascending=False:")
print(f"\tseries_12.sort_index(ascending=False).values: \n\t{series_12.sort_index(ascending=False).values}")
print(f"\tseries_12.sort_index(ascending=False).index: \n\t{series_12.sort_index(ascending=False).index.values}")
series_12:
	series_12.values:
	[ 1  2  3  4  5  6  7  8  9 10]
	series_12.index:
	['foo' 'bar' 'baz' 'qux' 'min' 'max' 'yoo' 'matt' 'mike' 'dave']
after sort_index with ascending=True:
	series_12.sort_index(ascending=True).values:
	[ 2  3 10  1  8  6  9  5  4  7]
	series_12.sort_index(ascending=True).index:
	['bar' 'baz' 'dave' 'foo' 'matt' 'max' 'mike' 'min' 'qux' 'yoo']
after sort_index with ascending=False:
	series_12.sort_index(ascending=False).values:
	[ 7  4  5  9  6  8  1 10  3  2]
	series_12.sort_index(ascending=False).index:
	['yoo' 'qux' 'min' 'mike' 'max' 'matt' 'foo' 'dave' 'baz' 'bar']
Series的筛选
Series对象可以通过在方括号中加入布尔表达式,来筛选符合条件的元素。下面是若干示例。
接下来的示例创建一个等差Series,并筛选出其中的偶数,观察用法和结果:
series_11 = pd.Series([x for x in range(1,11)])

print(f"raw data: {series_11.values}")
print(f"filtered: {series_11[series_11 % 2 == 0].values}")
raw data: [ 1  2  3  4  5  6  7  8  9 10]
filtered: [ 2  4  6  8 10]
为什么可行?
现在把== 0除去,观察式子series_11 % 2的值:
print(f"series_11 % 2: \n{series_11 % 2}")
series_11 % 2:
0    1
1    0
2    1
3    0
4    1
5    0
6    1
7    0
8    1
9    0
dtype: int64
仍然是series_11中每一个元素对2取余数的结果,组成了一个新的Series。
同样地,通过==运算符让series_11 % 2这个Series与0比较,获得一个布尔值的Series:
print(series_11 % 2 == 0)
0    False
1     True
2    False
3     True
4    False
5     True
6    False
7     True
8    False
9     True
dtype: bool
可以使用Series来访问Series。 观察下面的代码结果。
series_12 = pd.Series([1, 2, 3, 4, 5, 6, 7, 8, 9])
series_index_1 = pd.Series([1, 3, 5])
print(f"series_12:\n{series_12.values}")
print(f"series_index_1:\n{series_index_1.values}")
print(f"series_12[series_index_1]:\n{series_12[series_index_1]}")
series_12:
[1 2 3 4 5 6 7 8 9]
series_index_1:
[1 3 5]
series_12[series_index_1]:
1    2
3    4
5    6
dtype: int64
可以看到,使用Series访问Series时,将使用方括号中的Series(也就是代码中的series_index_1,其值为[1, 3, 5])的每一个值来访问(这种行为我们称为 “索引”)被访问的Series(也就是代码中的series_12)得到多个值,再次组成一个由索引到的值组成的Series作为结果。
形象的表示一下,就是:
series_12: [1, 2, 3, 4, 5, 6, 7, 8, 9]
               ^     ^     ^
              selected elements
======>    [2, 4, 6]
[2, 4, 6]被用来索引series_12,series_12中的索引值为1 3 5的元素被选中,组成了一个新的Series,于是结果便为[2, 4, 6]。
这是使用整数向量访问整数向量的情况,接下来讲述使用布尔型向量访问另一个向量的情况。
当在Series的方括号中使用布尔型值的Series索引,将会把所有值为True的元素“挑”出来,组成一个新的Series:
series_13 = pd.Series([1, 2, 3, 4, 5, 6, 7, 8, 9])
series_index_2 = pd.Series([True, False, True, False, True, False, True, False, True])
#                           0     1      2     3      4     5      6     7      8

print(series_13[series_index_2])
0    1
2    3
4    5
6    7
8    9
dtype: int64
所以,回到之前的示例(筛选偶数那个),通过series_11 % 2算出所有值除以2的余数组成一个序列,再通过将其与0比较(series_11 % 2 == 0)得到一个布尔型的Series(与准备索引的Series同长),使用这个Series让pandas“挑”出所有True对应的值,使得原来的值被筛选了出来。
筛选Series还有其他方法,其中一种是使用.where()方法,在其中传入序列(仅布尔值的与被筛选的序列同长的序列,或索引值序列。可以为ndarray,python列表或Series),或者函数(更广义的说,是可调用对象)便可以进行筛选操作。是的,一个函数可以作为其他函数的参数,甚至作为一个值被赋给变量。此处简单介绍上面的内容。请看以下示例。
def filterer(x):
    return x % 2 == 0

series_14 = pd.Series([x for x in range(30)])
print(f"raw data:")
print(series_14.values)
print(f"filter:")
print(series_14.where(filterer).values)
raw data:
[ 0  1  2  3  4  5  6  7  8  9 10 11 12 13 14 15 16 17 18 19 20 21 22 23
 24 25 26 27 28 29]
filter:
[ 0. nan  2. nan  4. nan  6. nan  8. nan 10. nan 12. nan 14. nan 16. nan
 18. nan 20. nan 22. nan 24. nan 26. nan 28. nan]
可以看出,.where()方法使用可调用对象进行筛选时,对于返回值为False的元素使用了NaN替代。去除Series中所有NaN值的最简单方法便是.dropna():
print(series_14.where(filterer).dropna().values)
[ 0. 2. 4. 6. 8. 10. 12. 14. 16. 18. 20. 22. 24. 26. 28.]
删除Series中的值
pop方法
使用.pop()可以删除并返回Series中指定的值。其接受一个int作为参数,代表要删除的值的索引。
.pop()将会把被删除的值返回。并且,.pop()将会修改原来的数据。
series_15 = series_14.copy()
print(f"before: {series_15.values}")
print(f"popped: {series_15.pop(0)}")
print(f"after:  {series_15.values}")
before: [ 0  1  2  3  4  5  6  7  8  9 10 11 12 13 14 15 16 17 18 19 20 21 22 23
 24 25 26 27 28 29]
popped: 0
after:  [ 1  2  3  4  5  6  7  8  9 10 11 12 13 14 15 16 17 18 19 20 21 22 23 24
 25 26 27 28 29]
drop方法
使用.drop()方法可以删除Series中的值并且将删除后的Series返回。这个函数本身不修改原来的Series。
这个函数接受labels命名参数来指定需要删除的元素的索引值。观察下面的示例。
series_16 = pd.Series([x for x in range(20)])

print(f"before: {series_16.values}")
print(f"dropped: {series_16.drop(labels=[0, 1, 2]).values}")
print(f"series_16 after dropped: {series_16.values}")
before: [ 0  1  2  3  4  5  6  7  8  9 10 11 12 13 14 15 16 17 18 19]
dropped: [ 3  4  5  6  7  8  9 10 11 12 13 14 15 16 17 18 19]
series_16 after dropped: [ 0  1  2  3  4  5  6  7  8  9 10 11 12 13 14 15 16 17 18 19]
使用del
使用del可以删除元素。而且del本身是一个关键字。观察下面的示例。
print(f"before: {series_16.values}")
del series_16[2]
print(f"series_16 after deletion: {series_16.values}")
before: [ 0  1  2  3  4  5  6  7  8  9 10 11 12 13 14 15 16 17 18 19]
series_16 after deletion: [ 0  1  3  4  5  6  7  8  9 10 11 12 13 14 15 16 17 18 19]
DataFrame
对于DataFrame,我个人不会讲太细,因为Series中$99\%$的操作在DataFrame中都支持,而且跟Series非常相似。可以说,了解透彻Series,那么了解DataFrame将会无比简单。
DataFrame本身是使用Series构成的,所以才支持Series中$99\%$的操作。很可惜,我们的技术组老师并不这么认为,而且把重点放在了DataFrame上。
导致我必须写这么长。
准备数据。data_1是一个字典,其中的值是列表。
data_1 = {
    "姓名" : [
        "小一", "小二", "小三", "小四",
        "小五", "小六", "小七"],
    "班级" : [1 , 2 , 3 , 3 , 2 , 1 , 3 ],
    "信息" : [28, 33, 35, 41, 46, 32, 22],
    "通用" : [32, 30, 32, 41, 36, 42, 23],
    "技术" : [0 , 0 , 0 , 0 , 0 , 0 , 0 ],
}
data_2是一个嵌套列表。
data_2 = [
#    姓名   班级  信息  通用  技术
    ["小八", 1  ,  29,  31,  0],
    ["小九", 2  ,  34,  30,  0],
    ["小十", 3  ,  32,  33,  0],
]
DataFrame的构造函数
DataFrame可以使用字典构造表格结构,其中表格中的每一个值都必须是一个列表。我们的data_1恰好满足要求,我们使用其构造df_1对象。
df_1 = pd.DataFrame(data_1)
df_1["技术"] = df_1["信息"] + df_1["通用"]

print(df_1)
   姓名  班级  信息  通用  技术
0  小一     1    28    32    60
1  小二     2    33    30    63
2  小三     3    35    32    67
3  小四     3    41    41    82
4  小五     2    46    36    82
5  小六     1    32    42    74
6  小七     3    22    23    45
DataFrame也可以使用嵌套列表构造。如果不添加额外参数,pandas使用类似于Series的机制,使用从零开始的下标填充每一个列的名字。
df_2 = pd.DataFrame(data_2)
print(df_2)
      0  1   2   3  4
0  小八  1  29  31  0
1  小九  2  34  30  0
2  小十  3  32  33  0
如果准备在使用嵌套列表的同时,又准备给每一列加上名字,可以使用columns命名参数,columns接受一个列表,列表的长度必须和列数一致,否则会报错:
try:
    df_2 = pd.DataFrame(data_2, columns=["姓名", "班级", "信息", "通用"])
except BaseException:
    print("看来是真的报错了")
看来是真的报错了
try...except语句用来捕捉try代码块中抛出的错误与异常,并在抛出错误或异常时,执行符合要求的except代码块。上面的示例中df_2 = pd...这行语句会产生300多行的错误信息(5页),为了节省篇幅,便使用了try...except代码块来捕捉错误,并向你们展示了这行语句真的会报错。(我觉得为了少两张纸,说这么多有必要。)
这样是正确的:
df_2 = pd.DataFrame(data_2, columns=["姓名", "班级", "信息", "通用", "技术"])
print(df_2)
   姓名  班级  信息  通用  技术
0  小八     1    29    31     0
1  小九     2    34    30     0
2  小十     3    32    33     0
当然,DataFrame的索引值也可以使用类似于Series的方法,即通过指定index参数(一个列表)来指定:
print(pd.DataFrame(data_2,
                   columns=["姓名", "班级", "信息", "通用", "技术"],
                   index=[3, 2, 1]))
   姓名  班级  信息  通用  技术
3  小八     1    29    31     0
2  小九     2    34    30     0
1  小十     3    32    33     0
操作DataFrame
访问一个值
首先,DataFrame可以访问对应列的值,此时返回的类型是Series:
print(df_2["技术"])
print(type(df_2["技术"]))
0    0
1    0
2    0
Name: 技术, dtype: int64
<class 'pandas.core.series.Series'>
所以利用索引一个列所返回的Series,我们可以访问DataFrame中的一个值:
print(df_2["技术"][0])
0
DataFrame还提供at属性,使用这个属性也可以访问一个值:
print(df_2.at[0, "信息"])
29
甚至使用values 和 array属性等等,访问一个值的方式多的去了:
print(df_2["信息"].values[0])
print(df_2["信息"].to_numpy()[0])
# ...
29
29
访问一列值
刚刚讲到,使用列的名字可以得到一列数据,类型为Series:
print(df_2["技术"])
0    0
1    0
2    0
Name: 技术, dtype: int64
注意列名会作为Series的名字存储在返回的Series中。
访问一行值
使用DataFrame的loc属性可以获得一行值。观察下面的示例。
print(df_2.loc[0])
姓名    小八
班级       1
信息      29
通用      31
技术       0
Name: 0, dtype: object
注意此时一行数据的所有列名变成了返回的Series的索引值。所以可以这么操作:
print(df_2.loc[0]["姓名"])
小八
添加列/行
使用insert方法可以添加列,默认接受三个参数。第一个参数表示插入的位置,用下标表示,第二个参数表示列名,第三个参数表示插入的数据,可以为Series,ndarray或Python列表。
观察以下示例。
df_3 = df_2.copy()
print(df_3)
df_3.insert(0, "学号", [220300260057, 220300260058, 220300260059])
print(df_3)
   姓名  班级  信息  通用  技术
0  小八     1    29    31     0
1  小九     2    34    30     0
2  小十     3    32    33     0
           学号  姓名  班级  信息  通用  技术
0  220300260057  小八     1    29    31     0
1  220300260058  小九     2    34    30     0
2  220300260059  小十     3    32    33     0
可以看到,insert在表中插入了一列数据。
注意,在教科书中大量使用的append方法在现在的Pandas库中已经被废弃,在之前可以使用append来在DataFrame的末尾插入一行数据,但现在没了,只能使用pd.concat了。pd.concat是Pandas的一个全局函数,用来连接两个DataFrame。其接受一个列表(其中包含DataFrame),并返回连接后的结果。观察下面的示例。
print("concatenated DataFrame object:")
print(pd.concat([df_1, df_2]))
concatenated DataFrame object:
   姓名  班级  信息  通用  技术
0  小一     1    28    32    60
1  小二     2    33    30    63
2  小三     3    35    32    67
3  小四     3    41    41    82
4  小五     2    46    36    82
5  小六     1    32    42    74
6  小七     3    22    23    45
0  小八     1    29    31     0
1  小九     2    34    30     0
2  小十     3    32    33     0
可以看到,连接后的DataFrame的索引值是按照原来参数中的DataFrame排列的,所以索引值并没有按照0~9的顺序排列。
如果想要修正这个问题,只需要加上ignore_index可选参数,其接受一个布尔值,若为True,那么会在连接后重新排列索引值。观察下面的示例。
print("concatenated DataFrame object, with ignore_index=True:")
print(pd.concat([df_1, df_2], ignore_index=True))
concatenated DataFrame object, with ignore_index=True:
   姓名  班级  信息  通用  技术
0  小一     1    28    32    60
1  小二     2    33    30    63
2  小三     3    35    32    67
3  小四     3    41    41    82
4  小五     2    46    36    82
5  小六     1    32    42    74
6  小七     3    22    23    45
7  小八     1    29    31     0
8  小九     2    34    30     0
9  小十     3    32    33     0
这样便可以修正这个问题。
筛选DataFrame中的数据
与Series类似,DataFrame可以使用Series访问。所以得到符合要求的Series,便可以筛选DataFrame中的数据。
注意!DataFrame不可以用DataFrame访问!
下面的示例筛选出了所有技术分数大于65分的学生。
df_3 = pd.concat([df_1, df_2], ignore_index=True)
df_3["技术"] = df_3["信息"] + df_3["通用"]
print(df_3)
print("filtered:")
print(df_3[df_3["技术"] > 65])
   姓名  班级  信息  通用  技术
0  小一     1    28    32    60
1  小二     2    33    30    63
2  小三     3    35    32    67
3  小四     3    41    41    82
4  小五     2    46    36    82
5  小六     1    32    42    74
6  小七     3    22    23    45
7  小八     1    29    31    60
8  小九     2    34    30    64
9  小十     3    32    33    65
filtered:
   姓名  班级  信息  通用  技术
2  小三     3    35    32    67
3  小四     3    41    41    82
4  小五     2    46    36    82
5  小六     1    32    42    74
df_3["信息"]返回Series对象,将其与65比较(df_3["技术"] > 65)返回符合要求的布尔型Series,用这个Series((df_3["技术"] > 65))访问df_3便可以得到筛选后的DataFrame。
当然,使用where也可以筛选DataFrame。此处不做介绍。
你们觉得最难的:分组
使用groupby可以对DataFrame分组。先观察下面的示例。
print(df_3.groupby("班级"))
print(df_3.groupby("班级")["技术"])
print(df_3.groupby("班级")["技术"].mean())
print(type(df_3.groupby("班级")["技术"].mean()))
<pandas.core.groupby.generic.DataFrameGroupBy object at 0x00000000140F25E0>
<pandas.core.groupby.generic.SeriesGroupBy object at 0x00000000140F2070>
班级
1    64.666667
2    69.666667
3    64.750000
Name: 技术, dtype: float64
<class 'pandas.core.series.Series'>
可以看到,df_3.groupby可以按照列数据对DataFrame进行分组,上面的示例中,我们通过在groupby中传入"班级"来对DataFrame按照班级分组。我们还对分组后的结果取了平均值。
分组后的结果可以进行很多的操作,比如…
- 使用
apply对结果逐组调用函数; - 使用
filter滤去不满足要求的元素(使用函数); - 使用
count得到每组的元素个数(不会包括NaN); - 使用
describe得到结果的总体描述; - 使用
fillna填充所有的NaN数据; - 使用
maxmin得到每组数据中的最大值 / 最小值; - 使用
mean得到每组数据的平均值; - 使用
median得到每组数据的中位数; - 使用
sum对每组数据求和; - 使用
var求每组数据的方差; - 使用
std求每组数据的标准差。
我们也常常需要输出分组后的数据,你会使用print输出分组后的数据。但…
groupby根本不会返回DataFrame或Series类型的对象!!!
你没听错。groupby不会返回DataFrame或Series,所以当你想要输出分组后的结果时,你会失望的:
print(df_3.groupby("班级"))
<pandas.core.groupby.generic.DataFrameGroupBy object at 0x00000000140F2CA0>
这里输出的东西是什么牛马?原来,groupby所返回的值的类型不支持输出,所以输出了返回值的类型信息。同时可以看出,对DataFrame调用groupby返回DataFrameGroupBy类型的对象,DataFrameGroupBy和另一种叫SeriesGroupby类型的对象支持相同的操作。而当我们索引DataFrameGroupBy时,则会返回SeriesGroupby类型的对象:
print(df_3.groupby("班级")["技术"])
<pandas.core.groupby.generic.SeriesGroupBy object at 0x00000000141934C0>
对SeriesGroupBy类型的对象进行计算比较常见。调用上面列表中的函数可以进行一系列计算。观察:
g_1 = df_3.groupby("班级")
g_2 = g_1["技术"]
print(f"""
type(g_1): {type(g_1)}
type(g_2): {type(g_2)}

g_2.mean():
{g_2.mean()}
g_1.count():
{g_1.count()}
""")
type(g_1): <class 'pandas.core.groupby.generic.DataFrameGroupBy'>
type(g_2): <class 'pandas.core.groupby.generic.SeriesGroupBy'>

g_2.mean():
班级
1    64.666667
2    69.666667
3    64.750000
Name: 技术, dtype: float64
g_1.count():
      姓名  信息  通用  技术
班级
1        3     3     3     3
2        3     3     3     3
3        4     4     4     4
DataFrame的排序
与Series类似,DataFrame可以使用sort_values可以对DataFrame 依照数据进行排序 ,也可以使用sort_index对DataFrame 依照索引值进行排序。使用axis命名参数来对排序轴向进行指定(0或1),使用ascending命名参数对排序升、降序进行指定。其中ascending参数默认为True,即按照升序排序;axis参数默认为0,即对行与行进行排序。
其中,sort_values必须要接受一个字符串作为第一个参数(这个参数叫做by),如果axis参数为0,那么Pandas就会按照by参数指定的 列名 交换排序DataFrame中的 每个行 ;若为1,那么Pandas就会按照by参数指定的 索引值对应的行数据 交换排序DataFrame中的 每个列。
观察下面的示例。
print("df_3 sorted with ascending=True:")
print(df_3.sort_values("技术", ascending=True))
print("df_3 sorted with ascending=False:")
print(df_3.sort_values("技术", ascending=False))
df_3 sorted with ascending=True:
   姓名  班级  信息  通用  技术
6  小七     3    22    23    45
0  小一     1    28    32    60
7  小八     1    29    31    60
1  小二     2    33    30    63
8  小九     2    34    30    64
9  小十     3    32    33    65
2  小三     3    35    32    67
5  小六     1    32    42    74
3  小四     3    41    41    82
4  小五     2    46    36    82
df_3 sorted with ascending=False:
   姓名  班级  信息  通用  技术
3  小四     3    41    41    82
4  小五     2    46    36    82
5  小六     1    32    42    74
2  小三     3    35    32    67
9  小十     3    32    33    65
8  小九     2    34    30    64
1  小二     2    33    30    63
0  小一     1    28    32    60
7  小八     1    29    31    60
6  小七     3    22    23    45
注意当ascending为False时,DataFrame的排序顺序倒过来了。
观察下面的示例。下面的示例将df_4按照索引值进行排序,并指定了不同的ascending参数。
df_4 = pd.DataFrame(df_3.values,
                    index=["foo", "bar", "baz", "qux", "matt", "dave", "alice", "bob", "lee", "david"],
                    columns=df_3.columns)
print(df_4)
print("df_4 sorted by index:")
print(df_4.sort_index())
print("df_4 sorted by index with ascending=False:")
print(df_4.sort_index(ascending=False))
       姓名 班级 信息 通用 技术
foo    小一    1   28   32   60
bar    小二    2   33   30   63
baz    小三    3   35   32   67
qux    小四    3   41   41   82
matt   小五    2   46   36   82
dave   小六    1   32   42   74
alice  小七    3   22   23   45
bob    小八    1   29   31   60
lee    小九    2   34   30   64
david  小十    3   32   33   65
df_4 sorted by index:
       姓名 班级 信息 通用 技术
alice  小七    3   22   23   45
bar    小二    2   33   30   63
baz    小三    3   35   32   67
bob    小八    1   29   31   60
dave   小六    1   32   42   74
david  小十    3   32   33   65
foo    小一    1   28   32   60
lee    小九    2   34   30   64
matt   小五    2   46   36   82
qux    小四    3   41   41   82
df_4 sorted by index with ascending=False:
       姓名 班级 信息 通用 技术
qux    小四    3   41   41   82
matt   小五    2   46   36   82
lee    小九    2   34   30   64
foo    小一    1   28   32   60
david  小十    3   32   33   65
dave   小六    1   32   42   74
bob    小八    1   29   31   60
baz    小三    3   35   32   67
bar    小二    2   33   30   63
alice  小七    3   22   23   45
Matplotlib 与 numpy
Matplotlib是Python的绘图库,使用一系列指令,可以简洁的操作图表,绘制图表。其与numpy的关系密切,有许多函数依赖ndarray类型作为参数。
numpy则是Python的张量(这种说法不专业)库,支持多维数据的快速运算与操作。pandas便是基于numpy开发的。numpy的主要类型是ndarray。
下面是一段Matplotlib的示例代码。这段代码绘制了一个简单的图表,并添加了图例。
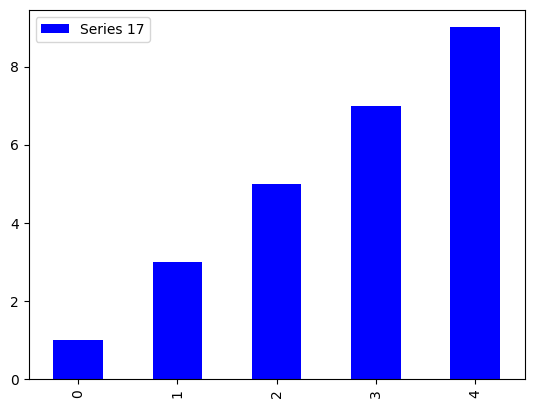
series_17 = pd.Series([1, 3, 5, 7, 9])
series_17.plot(kind='bar', color='blue', label='Series 17')
plt.legend()
plt.show()
上面的代码中,我们使用了pandas的Series自带的绘图函数plot,并使用了kind参数指定了图表的类型,color参数指定了图表的颜色,label参数指定了图例的名称。
Matplotlib的图表类型
Matplotlib的图表类型有多种,包括:
- 折线图(line chart)
- 柱状图(bar chart)
- 散点图(scatter plot)
- 饼图(pie chart)
- 箱线图(boxplot)等。
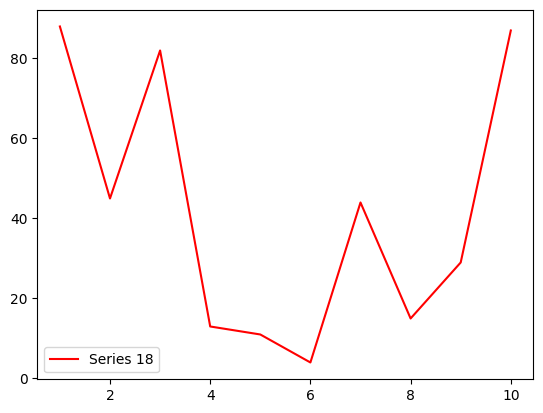
观察下面的示例。下面是一个使用Matplotlib绘制折线图的示例代码。
series_18 = pd.Series([random.randint(1, 100) for i in range(10)])
x_range = [i for i in range(1, 11)]
plt.plot(x_range, series_18, label='Series 18', color='red')
plt.legend()
plt.show()
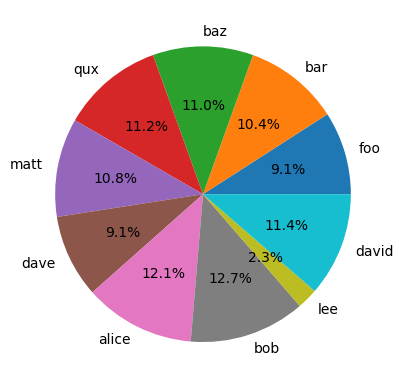
下面的代码绘制了一个饼图。
series_19 = pd.Series([random.randint(1, 100) for i in range(10)])
plt.pie(series_19, labels=df_4.index, autopct='%1.1f%%')
plt.show()
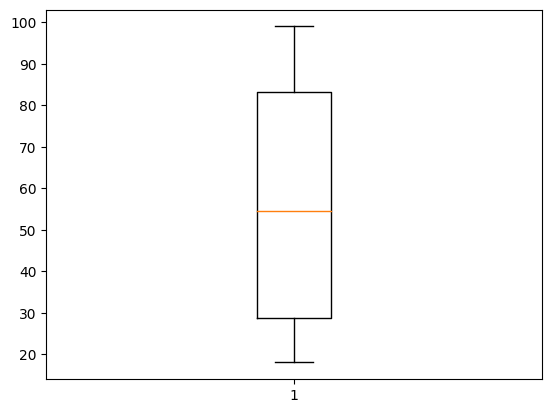
下面的代码绘制了一个箱线图。
series_20 = pd.Series([random.randint(1, 100) for i in range(10)])
plt.boxplot(series_20)
plt.show()
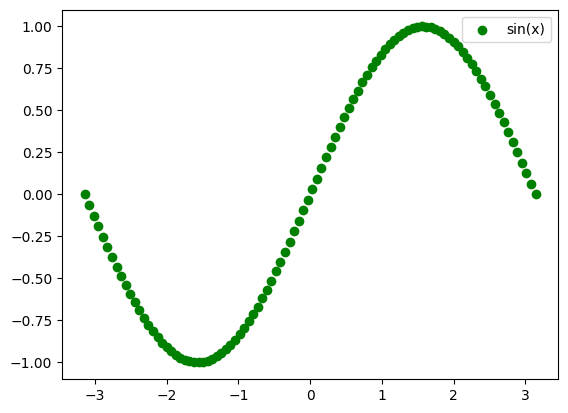
下面的代码绘制了$f(x)=\sin(x)$的散点图。
x = np.linspace(-np.pi, np.pi, 100)
y = np.sin(x)
plt.scatter(x, y, label='sin(x)', color='green')
plt.legend()
plt.show()
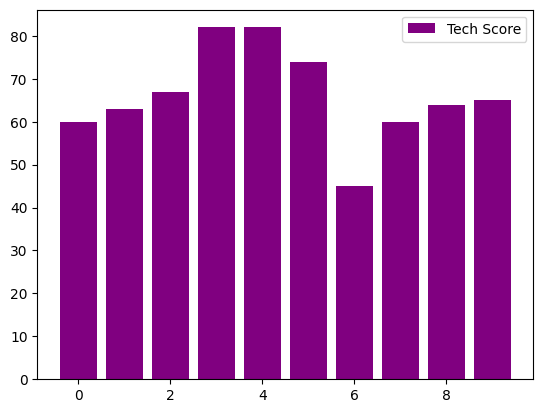
下面的代码绘制了df_3中所有学生技术成绩的柱状图。
plt.bar(df_3.index, df_3['技术'], label='Tech Score', color='purple')
plt.legend()
plt.show()
从上面的所有示例中可以看出,Matplotlib的绘图函数非常灵活,可以根据需求绘制出不同的图表类型。使用plt.bar函数可以绘制柱状图,使用plt.plot函数可以绘制折线图,使用plt.scatter函数可以绘制散点图,使用plt.pie函数可以绘制饼图,使用plt.boxplot函数可以绘制箱线图。使用plt.legend函数可以添加图例,使用plt.title函数可以添加标题,使用plt.xlabel和plt.ylabel函数可以添加x轴和y轴的标签。
matplotlib使用上述的一系列函数来控制图表绘制,可以实现各种不同的图表类型。
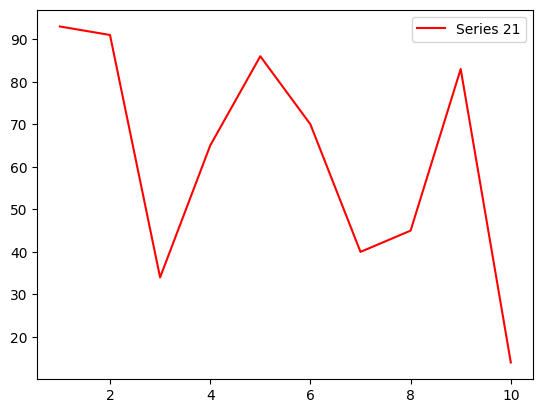
使用plt.show函数可以显示绘制的图表。观察下面的示例。
series_21 = pd.Series([random.randint(1, 100) for i in range(10)])
x_range = [i for i in range(1, 11)]
plt.plot(x_range, series_21, label='Series 21', color='red')
plt.legend()
plt.show()
上面的代码中,plt.plot函数用于绘制折线图,plt.legend函数用于添加图例,plt.show函数用于显示绘制的图表。
设置x轴和y轴的刻度范围
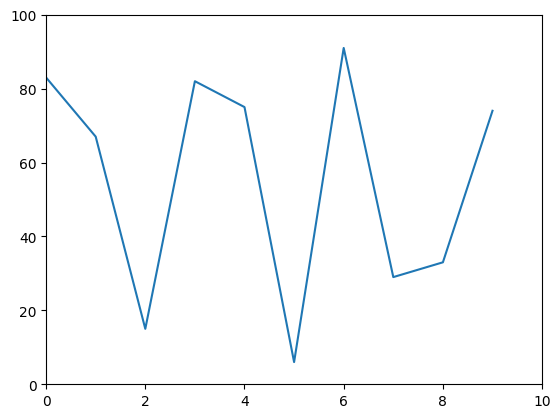
使用plt.xlim和plt.ylim函数可以设置x轴和y轴的刻度范围。观察下面的示例。
series_22 = pd.Series([random.randint(1, 100) for i in range(10)])
plt.plot(series_22)
plt.xlim(0, 10)
plt.ylim(0, 100)
plt.show()
上面的代码中,plt.xlim函数用于设置x轴的刻度范围,plt.ylim函数用于设置y轴的刻度范围。两个函数都接受两个参数,分别表示刻度的最小值和最大值。
设置x轴和y轴的刻度标签
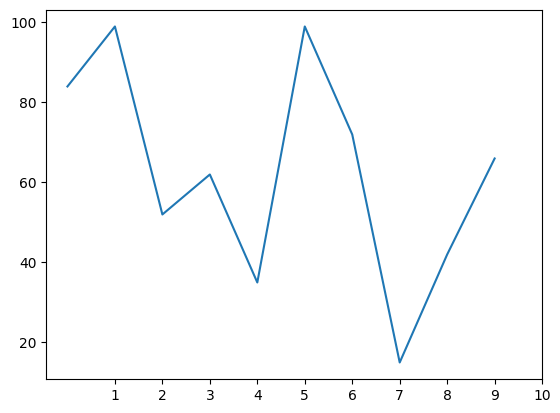
使用plt.xticks和plt.yticks函数可以设置x轴和y轴的刻度标签。观察下面的示例。
series_23 = pd.Series([random.randint(1, 100) for i in range(10)])
plt.plot(series_23)
plt.xticks([1, 2, 3, 4, 5, 6, 7, 8, 9, 10])
plt.show()
上面的代码中,plt.xticks函数用于设置x轴的刻度标签,plt.yticks函数用于设置y轴的刻度标签。其接受一个列表作为参数,列表中的元素是x轴和y轴的刻度标签。
设置图表的标题
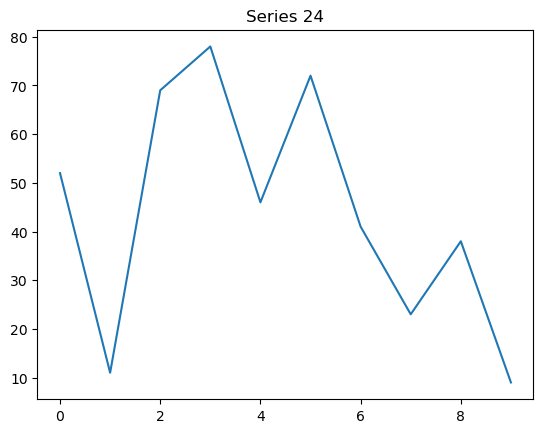
使用plt.title函数可以设置图表的标题。观察下面的示例。
series_24 = pd.Series([random.randint(1, 100) for i in range(10)])
plt.plot(series_24)
plt.title('Series 24')
plt.show()
上面的代码中,plt.title函数用于设置图表的标题,参数是字符串。
设置图表的网格线
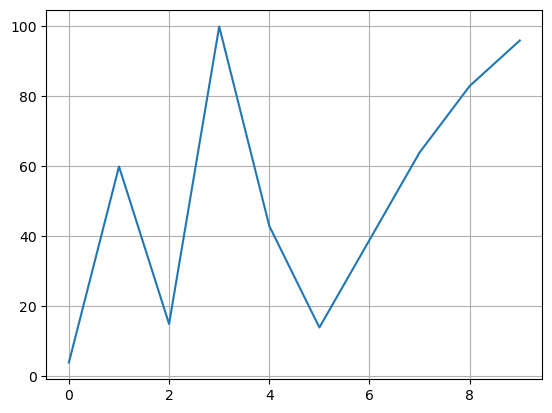
使用plt.grid函数可以设置图表的网格线。观察下面的示例。
series_25 = pd.Series([random.randint(1, 100) for i in range(10)])
plt.plot(series_25)
plt.grid(True)
plt.show()
上面的代码中,plt.grid函数用于设置图表的网格线。其接受一个布尔值参数,表示是否显示网格线。
设置图表的坐标轴
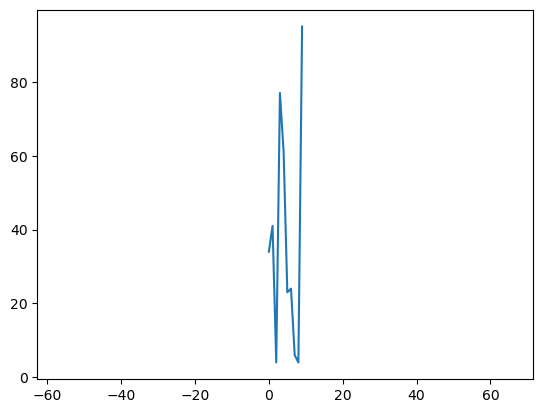
使用plt.axis函数可以设置图表的坐标轴。观察下面的示例。
series_26 = pd.Series([random.randint(1, 100) for i in range(10)])
plt.plot(series_26)
plt.axis('equal')
plt.show()
上面的代码中,plt.axis函数用于设置图表的坐标轴。equal表示坐标轴的刻度相同。
设置图表的颜色
使用color参数可以设置图表的颜色。观察下面的示例。
series_27 = pd.Series([random.randint(1, 100) for i in range(10)])
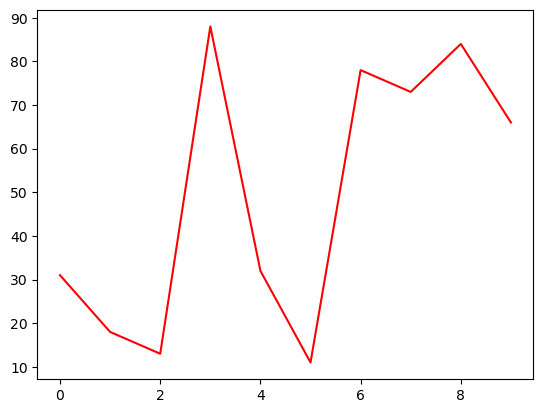
plt.plot(series_27, color='red')
plt.show()
上面的代码中,color参数用于设置图表的颜色。red表示红色、blue表示蓝色、green表示绿色、yellow表示黄色、black表示黑色、white表示白色。
设置图表的线型
观察下面的示例。
series_28 = pd.Series([random.randint(1, 100) for i in range(10)])
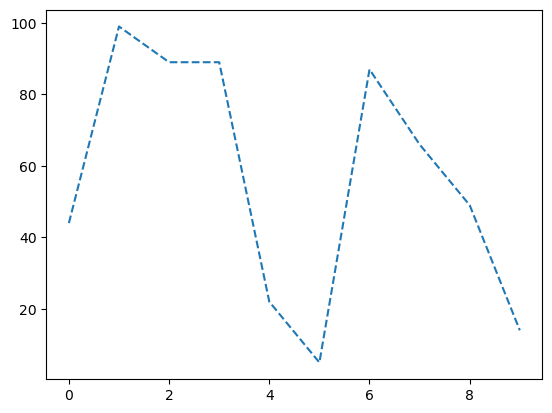
plt.plot(series_28, linestyle='--')  # 使用虚线线型
plt.show()
上面的代码中, linestyle参数用于设置图表的线型。使用--表示使用虚线线型、使用-表示使用实线线型、使用:表示使用点线线型。
设置图表的标记
观察下面的示例。
series_29 = pd.Series([random.randint(1, 100) for i in range(10)])
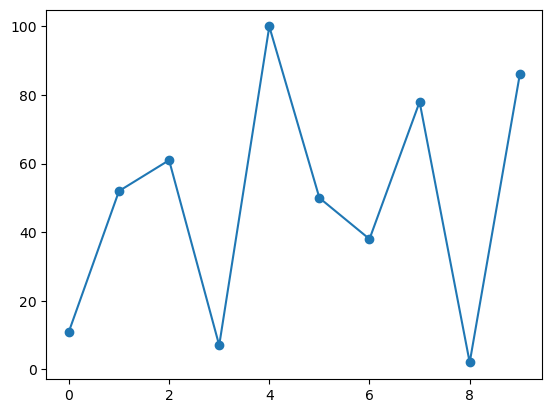
plt.plot(series_29, marker='o')  # 使用圆点标记
plt.show()
上面的代码中,marker参数用于设置图表的标记。使用o表示使用圆点标记、使用s表示使用正方形标记、使用*表示使用星号标记、使用+表示使用加号标记、使用x表示使用叉号标记、使用^表示使用三角形标记。

